Aegis Analytics
Aegis Analytics is a project controls portfolio and project dashboard solution built for the construction industry – designed by construction experts. Our custom-built software allows teams to manage any number of projects in one location. Our dashboards allow you to understand the health of your project portfolio, quickly identify projects at risk, and generate insights into your projects. Our reports provide measurable indicators for your projects – including progress, cost, quality control, and risk trends.

Pricing and purchase information
Learn moreProject health at the tips of your fingers
Built specifically for the construction industry, Aegis Analytics is fine-tuned to display all critical project controls information in one place through a real-time dashboard built from your projects’ CPM schedules.
This allows construction companies to get ahead of the curve when managing many projects and allows teams to quickly review and identify critical areas of need.

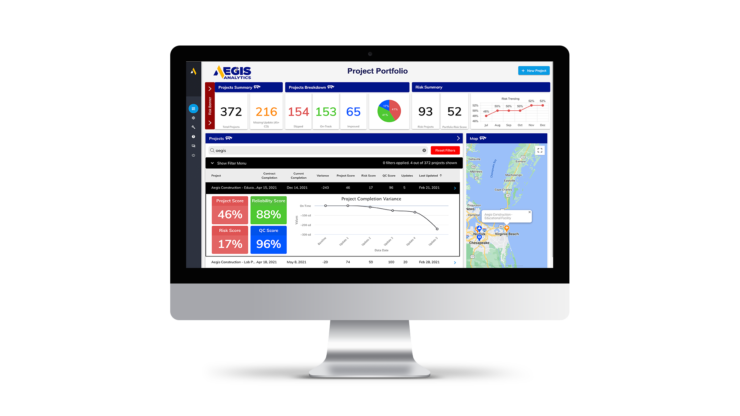
Project Portfolio
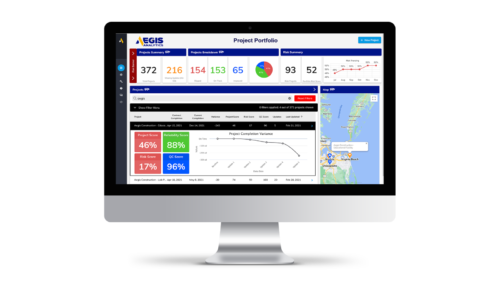
Your project portfolio gives you a snapshot of the health of all your projects. This page gives you feedback on your entire portfolio and allows you to sort, filter, and find the project or projects you seek. With one click of the mouse, you can zoom into the details of a project without leaving the portfolio page or jump into the project’s dashboard for more detailed information.

Project Insights
Aegis Analytics is an essential platform for construction and project controls professionals who demand precision, efficiency, and clarity for their projects.
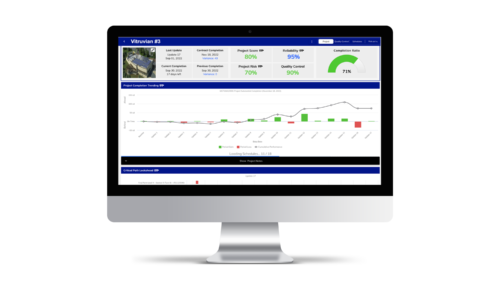
Aegis Analytics records every scheduled activity, from groundbreaking to hand-off, allowing you to visualize your entire project timeline in one dashboard. With a single click, our dashboard identifies critical path activities that impact project duration.
Our dashboard gives you access to detailed task completion rates, pinpoints bottlenecks, optimizes workflows, and gives you the tools to bring your projects in on time and on budget. Aegis Analytics also provides feedback on upcoming activities and the critical work that needs to be completed in the upcoming update period.
No more guesswork—focus your efforts where they matter most.

Cost Tracking
With integrated budgets, completion costs, and historical performance, Aegis Analytics uses cost-loaded schedules to provide comprehensive insights into your project’s fiscal health. Our one-click reporting lets you visualize planned, current, at-completion costs, and variances.

Quality Control
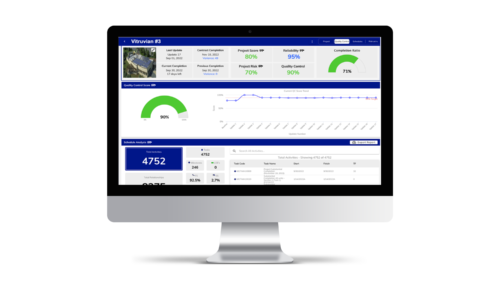
A great schedule is the foundation of an effective project controls plan. Aegis Analytics quality control page helps you improve your project by giving valuable insights into your project’s schedule quality and dependability. You can quickly identify missing and bad logic, high durations, large total floats, and numerous other metrics. Our quality control page also performs the full DCMA 14-point Schedule Assessment. Both our quality control report and the DCMA assessment are available for your reporting needs via download.

Risk
Aegis Analytics changes the way we look at risk in the construction industry. Our dedicated team of risk professionals reimagined what risk information a company would need to make informed decisions. Our teams help customers prioritize schedule risks based on their impact, visualize risk scenarios, and stay ahead of challenges to ensure on-time and on-budget delivery.
Reactive Risk Register™
Our add-on service option, Reactive Risk Register™, leverages the power of the cloud to create a new kind of risk register. Reactive Risk Register ™ connects your risk register to your project schedules and performs advanced Monte Carlo simulations on the fly to predict thousands of project scenarios with your project to determine the likelihood of hitting key deadlines. By leveraging the cloud, teams can now work together to monitor and maintain their risk registers.
Reactive Risk Register™ will also quickly compute the effects of your mitigation plan, determine which mitigative efforts will result in the most improvement, and even compute your cost-to-benefit ratios for each risk.
Performance trending
Imagine a product that analyzes the performance of the trades during construction and extrapolates how their work impacts your project. Our performance trending service factors in trade performance and the uncertainties in upcoming task durations to provide a comprehensive view of potential outcomes.

Make it yours
Custom-fit to your organization
Organize your project portfolio to align with your organization’s internal structure. Visualize your performance by location, division, business line, or any other structure that helps you assess portfolio performance.
Project portfolio
Our powerful filters allow you to sort and organize your portfolio with over 20 metrics. Modify and save custom layouts to organize your project information exactly how you need it.
Project dashboard
Customize your project, progress, quality control, and predictability scores. We allow our users to determine which KPIs are important to them.
Cost
Leverage cost-loaded schedules to see comprehensive project financial insights. One-click reporting visualizes planned, current, and at-completion costs, along with variances.
Risk
Analytics lets your team compute risk on a project-by-project basis. Whether you want to use our standard KPIs, performance trending, or our Reactive Risk Register™, it is up to you.
Sharing
Share your project dashboard with external users or download any required data with a single click .pdf report.